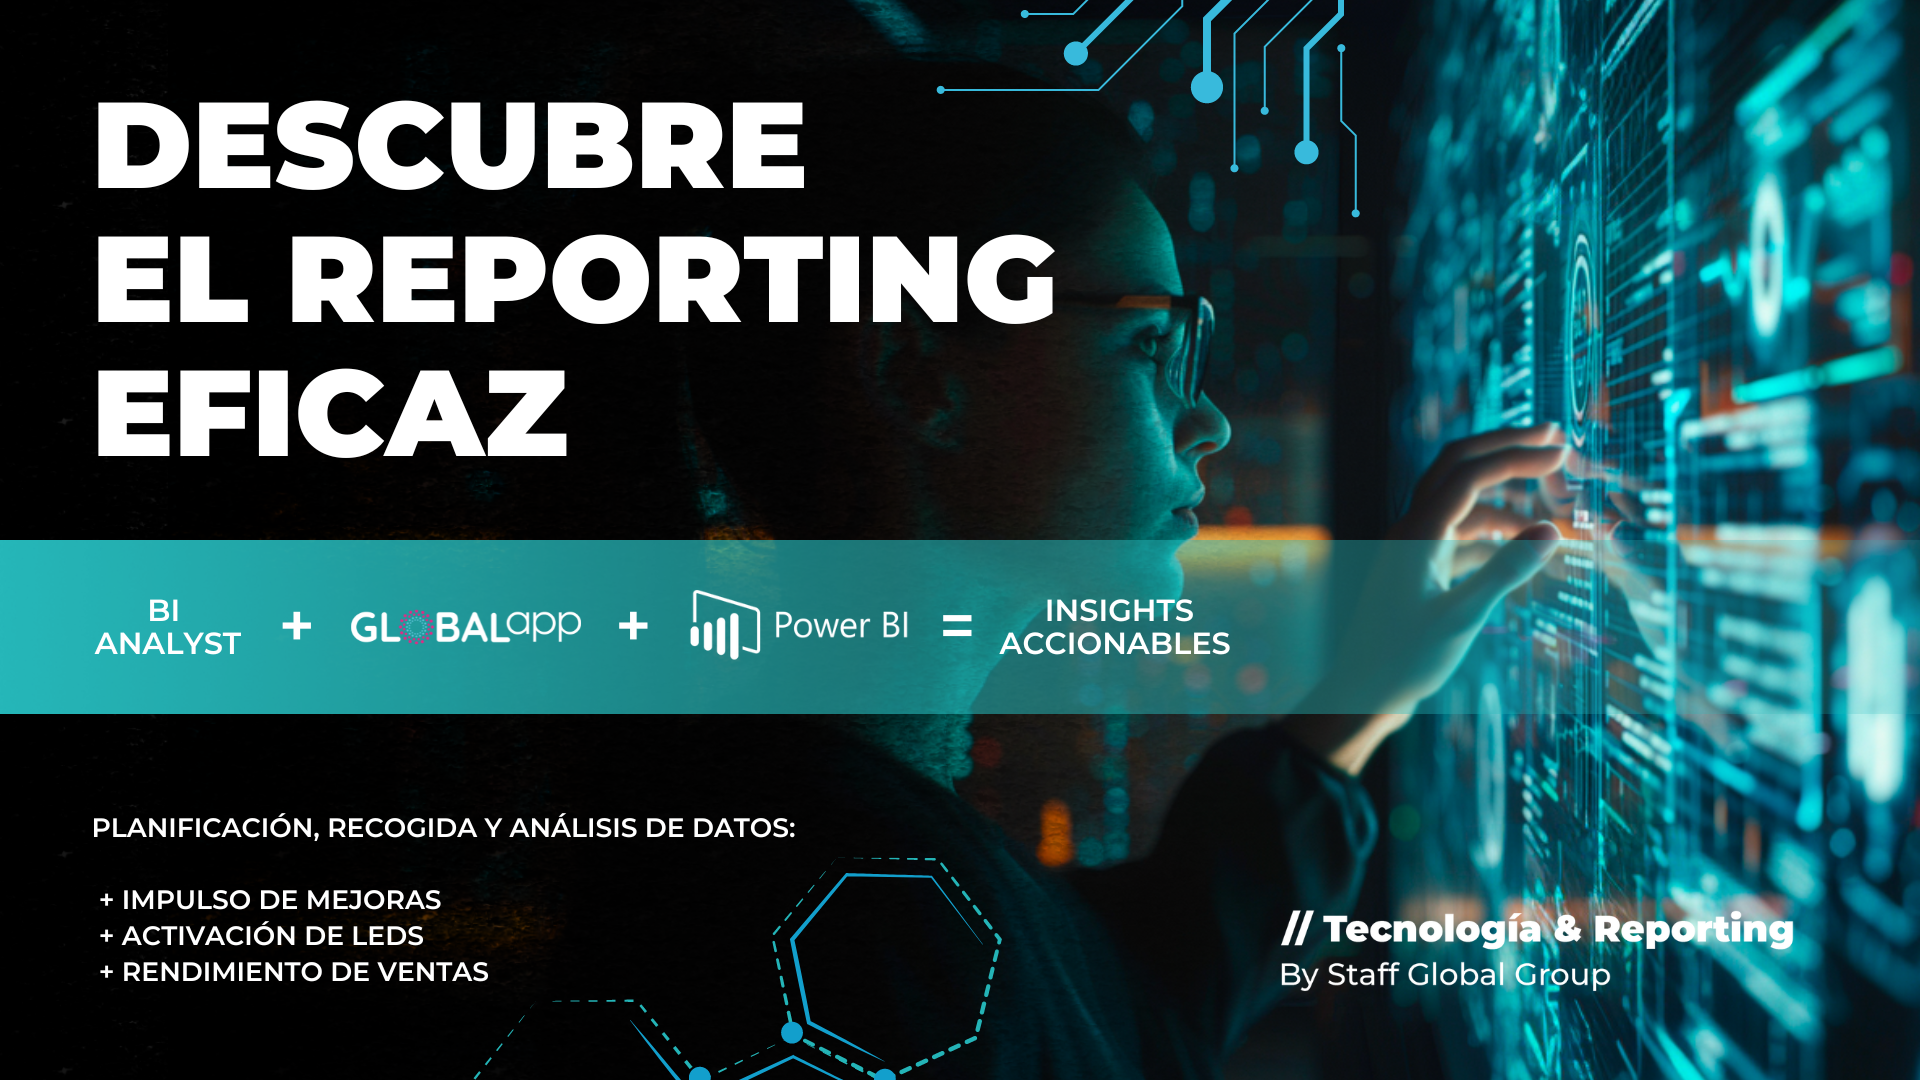
Reporting: The integration of data analysis, strategic planning and continuous improvement

The business environment is characterized by intense competition and rapid evolutions, the ability of a company to not only strategically plan its sales campaigns, but also analyze and act on data in real time is more than an advantage; it is a necessity. At Staff Global Group we face each Reporting project through the figure of the Data Analyst specialist through a previous strategic planning work that will define the success of the collection, processing and interpretation of the data. This article explores how merging strategic sales planning with advanced data analytics provides the ability to react successfully in the market, highlighting the crucial role data analysts play in this process.
The foundation of an effective sales strategy:
The starting point for any successful sales campaign is a well-defined strategy of the objectives and success variables, as well as the key measurement factors. This strategy should clarify the objectives, identify the target audience, and design the messages and tactics that will resonate with that audience. This is where data collection and analysis play a critical role. Tools such as Global App (created and developed by Staff Global Group) that facilitate data collection in the field, and advanced analysis platforms such as Power BI, become essential pillars to understand and adapt strategies effectively.
The key role of the data analyst:
The data analyst is the central figure in this ecosystem, acting as the link between raw data and strategic decisions. Through advanced tools, the analyst is able to extract, interpret, and present data in a way that is understandable and actionable for the sales team. The dashboards and reports they develop not only visualize sales performance and market trends, but also allow for deep exploration and real-time interaction with data, thus facilitating key decision-making based on up-to-date information. At Staff Global we are committed to the figure specialized in Data Analysis.
Powerful Insights and Visualizations: The Core of Data Analysis:
The interpretation of the data goes beyond simply observing trends; It involves understanding the reasons behind these patterns and how they can be leveraged to improve sales strategies. This depth of analysis, combined with the ability to visualize data through interactive and understandable dashboards, provides sales teams with the tools needed to adapt their approaches in real-time, personalize customer interactions, and ultimately improve sales team performance.
Global App, a tool for use in the field:
Global App is Staff Global Group‘s own tool created for the comprehensive management of equipment with specific data collection functionalities that allow geolocation of photographic data, equipment and in turn collect valuable data in the field to be properly processed through analysis tools.
Power BI, a powerful tool in the hands of our Data Analysts
Power BI is a powerful data analysis and visualization tool that allows users to transform data from various sources into cohesive, visually immersive, and interactive insights. It offers a set of software, applications, and connectors that work together to make it easy to connect to data sources, visualize and discover important aspects, and share those findings. But for this, at Staff Global Group, we have the figure of the Data Analyst perfectly trained to get the most out of this tool.
Power BI consists of several key components:
- Power BI Desktop: A desktop app for Windows that is used to create reports and data models.
- The Power BI service: An online service (SaaS) for sharing, visualizing, and collaborating on reports and dashboards.
- Power BI mobile apps: Available for Windows, iOS, and Android devices, they allow you to access reports and dashboards on the go
In addition, Power BI offers tools such as Power BI Report Builder for creating paginated reports, and Power BI Report Server, an on-premises solution for publishing Power BI reports
The integration between these components means that Power BI is extremely flexible, allowing different users depending on their role, from report creators to data consumers to administrators, to use the tool in a way that best suits their needs. For example, report creators can use Power BI Desktop to build detailed reports, publish those reports to the Power BI service so others can view and collaborate on them, and then access those reports through mobile apps.
The importance of Dashboards and proactivity in “actionable”, the hallmark of Staff Global Group:
The development of quality dashboards, which distill key and actionable information, becomes a cornerstone for success. At Staff Global Group, we are fully aware that ‘bullshit information’ – irrelevant or superficial data – not only diverts attention but can lead to counterproductive decisions. This is why we reject the standard formats that are often promoted in this type of sales reporting and opt, instead, for the presentation of customized dashboards. These focus on conclusive data and actionable measures, meticulously designed to provide sales teams with the precise intelligence they need to act effectively. In doing so, we not only raise the bar for our analysis and reporting, but we also reaffirm our commitment to long-term success, based on the quality and relevance of the information we handle. One of the characteristics of our unique Reporting model is our proactivity when it comes to involving different departments that draw up realistic action and activation plans that are proposed to our clients proactively.
